
Hey guys so today i would like to post an article about the most important commands every Admin / Engineer must know in order to understand whats going on in their Linux machine. So let’s start:
The Top Command
This command is one of the most important command for any Linux user. It gives you full system info in a single glance.
To run top command type the following:
salman@Linux:~> top
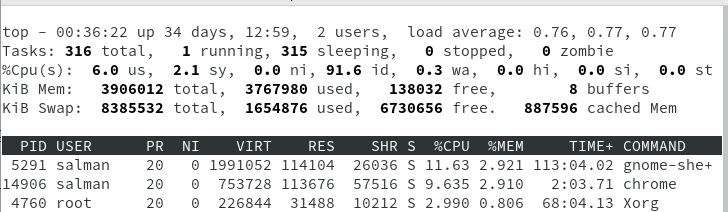
So let me show you what few of the things shown in above screenshot means:
1) 00:36:22 is the current time, up 34 days, 12:59 means system is up for how many days and hours, 2 users means 2 users are logged in.
2) Load average: 0.76 is the load average of system in last 1 min, 0.77 is the load average in last 5 mins and 0.77 is the la in last 15 mins.
3) %CPU = What percentage of CPU is being used. Press 1 to see all the cores of the system
4) Mem = Memory size , the rest is self explanatory. Press M
5) Zombie = Processes whose data remains in the memory even after they are terminated.
6) WA = The time CPU waits for I/O to be completed is wa or wait time.
7) ID = The time CPU remains idle.
8) HI = Hardware Interrupt
9) SI = Software Interrupt
10) ST = Steal Time is the time lost due to waiting to get resources from CPU. Mostly used in Virtual environment. If greater than 10% for 25 minutes, requires attention as it means that the machine is performing slower.
Now on the lower part:
6) PID = Process id
7) USER= User who started the process
8) PR/NI = Priority and Nice value , Nice value effects the priority of a process. Lower nice value means higher priority and vice versa.
9) VIRT = The total amount of virtual memory used by the task.
10) RES = This is a resident memory which is the non-swapped physical memory a task has used.
11) SHR = Shared memory with other processes.
12) S = Status of a process it can be one of the below:
The status of the task which can be one of:
D = uninterruptible sleep
R = running
S = sleeping
T = traced or stopped
Z = zombie
13) Time + = Total CPU time used by the process /task since it started.
14) Command = Name of the process.
*Note to get details of a specific process let’s say chrome, you can type:
salman@Linux:~> top | grep chrome
3278 salman 20 0 969348 223536 43460 S 12.50 5.723 4:23.19 chrome
2539 salman 20 0 1475352 246336 90532 S 6.250 6.307 23:33.54 chrome
2577 salman 20 0 657672 124012 50900 S 6.250 3.175 31:00.94 chrome
16330 salman 20 0 723356 59792 32524 S 6.250 1.531 1:27.85 chrome
To get the information about the processes run by specific user, run the following command:
salman@Linux:~> top -u root
The above will show processes running by user root
Note: On a single core the load average of a machine must be under 1. 1, for single core it means 100% load. If the load is continuous you must check the issue and find the solution before it’s too late. ( Dos attacks, Viruses and corrupt scripts could cause machine to over load.
The lsblk Command
lsblk or list block device command is another useful command for Linux admins. The command when type will display all the block devices along with their mount point. The lsblk command reads the sysfs filesystem ( The sysfs filesystem is commonly mounted at /sys) and udev db (Dynamic Device Management) to gather the information
An example of lsblk can be seen below:
salman@Linux:~> lsblk
NAME MAJ:MIN RM SIZE RO TYPE MOUNTPOINT
sda 8:0 0 931.5G 0 disk
└─sda1 8:1 0 931.5G 0 part /home
sdb 8:16 0 223.6G 0 disk
├─sdb1 8:17 0 8G 0 part [SWAP]
├─sdb2 8:18 0 502M 0 part /boot/efi
└─sdb3 8:19 0 214.6G 0 part /boot/grub2/x86_64-efi
The df Command
This command is very important for sys admins to get information about the space available.
df stands for disk free and it reports the disk space usage.
 Linux:/home/salman/Pictures # df -h
Filesystem Size Used Avail Use% Mounted on
devtmpfs 1.9G 0 1.9G 0% /dev
tmpfs 1.9G 130M 1.8G 7% /dev/shm
tmpfs 1.9G 2.7M 1.9G 1% /run
tmpfs 1.9G 0 1.9G 0% /sys/fs/cgroup
/dev/sdb3 215G 28G 188G 13% /
/dev/sdb3 215G 28G 188G 13% /var/log
-h means human readable.
Use -BM option such as df -BM to display the size in bytes.
The du Command
This command gives you information about the disk usage. Let’s say you want to see the size of a directory including it’s content. Use the following command:
Linux:/home/salman # du -sh Downloads/
822G Downloads/
In above example
-sh means to show summary in human read able option. For more info about the command use man page or type help
The stat Command
This command display file or file system status and is usually overlooked. It is a very important command while working with files and file system.
Some examples of stat command are:
Displaying octal permissions of a file or directory [(usually they are in human readable form such as rwx- (read , write , execute)]
Linux:/home/salman/Pictures # stat -c %a userlist.txt
644
Linux:/home/salman/Pictures # stat -c %a WP-PICS/
755
As you can see in the above example we used stat command to convert human readable format to show access rights in octal format.
-c means the format we would like to use
%a option is used to convert the human readable format to octal format
Stat command without any option will display a lot of information including type of file, when it was created, accessed, size, permissions in both octal and human readable form and a lot more. Lets take a look at it now
salman@Linux:~> stat Courses/
File: 'Courses/'
Size: 62 Blocks: 0 IO Block: 4096 directory
Device: 801h/2049d Inode: 1612819653 Links: 6
Access: (0755/drwxr-xr-x) Uid: ( 1000/ salman) Gid: ( 100/ users)
Access: 2020-08-30 23:14:55.565696657 +0600
Modify: 2018-08-07 21:05:42.668031778 +0600
Change: 2018-08-07 21:05:42.668031778 +0600
Birth: -